DEMO for "Latent Variable Graphical Model Selection using Harmonic Analysis"
Won Hwa Kim*, Hyunwoo J. Kim*, Nagesh Adluru, Vikas Singh, Latent Variable Graphical Model Selection using Harmonic Analysis: Applications to the Human Connectome Project (HCP), Computer Vision and Pattern Recognition (CVPR) , June, 2016 (Spotlight). Both * are the joint first authors.
Github repository: http://github.com/MLman/lvgm-cvpr2016/
Github page: http://mlman.github.io/lvgm-cvpr2016/
The last update by Hyunwoo J Kim 2016/06/24 13:43:24 (CDT) (CST)
Contents
Data synthesis
clc;clear;close all;
rng default
N = 70;
NO = 50;
NC = 10;
density = .5e-1; % a rough estimate of the amount of edges
[theta,theta_GT]= random_sparse_network(NO, NC, N, density);

% covariance matrix
sigma = pinv(theta);
sigma = (sigma+sigma')./2;
mu = zeros(1,N);

nsamples = 2000;
r = mvnrnd(mu,sigma,nsamples);
Xo = r(1:nsamples, 1:NO+NC);
Cov = Xo'*Xo./nsamples;
P = pinv(Cov);
Proposed method.
A0 = inv(Cov);
invA0 = Cov;
[V, D] = eig(Cov);
lambda = diag(D);

% kernel function
kid = 1;
kernel = mysgwt_func(kid);
option.c1 =0.01; % step size
option.gamma = 2; % sparsity parmeter
option.s0 = .2;  % intial point
option.tol = 1e-5; % tolerance
option.niter = 20000; % number of iteration
option.kernel = kernel; % Normalized Kernel function and derivative.

tic;
[A, s_opt, ghistory, fhistory] =  faster_solverK(V, D, option);
toc;

thetaO = theta(1:NO+NC, 1:NO+NC) ;
AA = abs(A);
PP = abs(P);
low = 0.01;
high = .5;
iter 1, f=2.284884 |grad|=0.000055, s=0.200001
iter 2, f=2.284894 |grad|=0.000055, s=0.200001
iter 3, f=2.284905 |grad|=0.000055, s=0.200002
iter 4, f=2.284916 |grad|=0.000055, s=0.200002
iter 5, f=2.284927 |grad|=0.000055, s=0.200003
iter 6, f=2.284938 |grad|=0.000055, s=0.200003
iter 7, f=2.284949 |grad|=0.000055, s=0.200004
iter 8, f=2.284960 |grad|=0.000055, s=0.200004
iter 9, f=2.284971 |grad|=0.000055, s=0.200005
iter 10, f=2.284982 |grad|=0.000055, s=0.200005
...
iter 5811, f=2.313952 |grad|=0.000010, s=0.201447
iter 5812, f=2.313954 |grad|=0.000010, s=0.201447
iter 5813, f=2.313956 |grad|=0.000010, s=0.201447
iter 5814, f=2.313958 |grad|=0.000010, s=0.201447
iter 5815, f=2.313960 |grad|=0.000010, s=0.201447
iter 5816, f=2.313962 |grad|=0.000010, s=0.201448
Elapsed time is 3.016885 seconds.
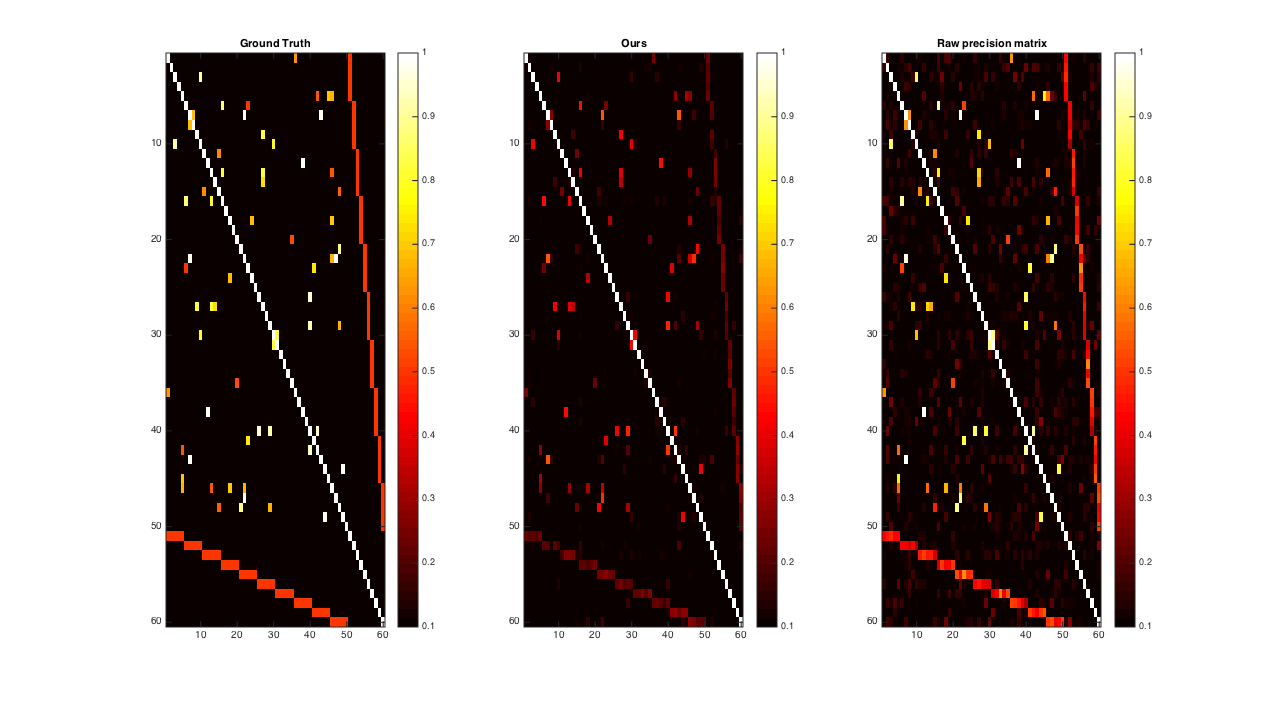
visualization
low = 0.1;
high = 1;
figure;
set(gcf,'units','normalized','position',[0 0 1 1]);
subplot(1,3,1);imagesc(abs(theta_GT(1:(NO+NC),1:(NO+NC))));colorbar;caxis([low high])
title('Ground Truth');
subplot(1,3,2);imagesc(abs(AA));colorbar;caxis([low high])
title('Ours');
subplot(1,3,3);imagesc(abs(P));colorbar;caxis([low high])
title('Raw precision matrix');
colormap hot